
Over recent months, IGPA has developed multiple Pandemic Stress Indicators, designed to evaluate the social and economic effects of the COVID-19 pandemic on Illinois residents. The first stress indicator is a frequent poll of three sets of experts about pandemic policies. Experts on economics, public health, and/or vulnerable populations from across Illinois have generously agreed to provide regular opinions on various pandemic policies. In answering the surveys, all panelists provide only their personal views and do not offer official positions on behalf of their respective institutions.
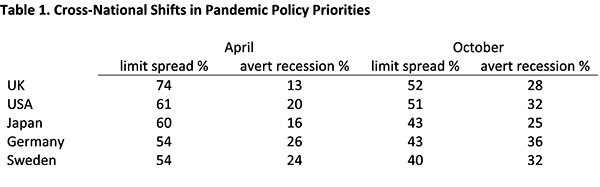
The ninth wave of the Pandemic Stress Indicator Expert panel survey was launched on October 25, and we had 18 total responses. One item of the ninth survey related to what some regard as a fundamental tension in policymaking just now, protecting public health and protecting the economy. We noted some cross-national data showing that the general publics in several democracies continue to favor the former, but less dramatically than was the case months back. Table 1 summarizes some recent findings about mass opinion in this regard.[i]
Respondents in national surveys were asked to pick one of the following: “The priority for the Government should be to limit the spread of the disease and the number of deaths, even if that means a major recession or depression, leading to businesses failing and many people losing their jobs”; or, “The priority for the Government should be to avert a major recession or depression, protecting many jobs and businesses, even if that means the disease infects more people and causes more deaths.”
n=18
We did not pose that same choice to our respondents, but, instead, asked them to characterize their reaction to this multi-nation, public-opinion shift, as “surprising” and/or “worrying.” Fourteen of the 18 respondents found the trend not surprising but worrying. The few dissenters were one respondent who thought the trends neither surprising nor worrying, one who rejected the question framing as a false dichotomy, while declining to react to it, and two who thought the pattern is both surprising and worrying. So, even while more citizens of democracies continue to say that they prioritize disease control, more than half a year into this pandemic, most of the experts in our panel are anxious to see that priorities are shifting at all towards averting recession or depression, in lieu of preventing disease spread. Ideally, of course, governments aim to prevent both surges in cases and a prolonged, deep economic slump. But, with seven months of experience of a variety of policy mixes across the globe, it is far from clear how best to protect both at once.
We also asked respondents to rate some claims made in popular debates about pandemic policy, with the response options “definitely untrue”, “probably untrue”, “unsure about truth”, “probably true”, and “definitely true”. In Table 2, we arrange the first set of items, mostly related to actions by public officials, by perceived truth, using abbreviated labels.
Almost all of the respondents agreed that “Many Americans' interpretations of pandemic policies have been strongly driven by partisanship” and also that “State comparisons in the US prove that shutdowns delayed new cases, protecting hospital and ‘buying time’." There was a little more uncertainty about the companion item referencing “Country comparisons,” perhaps suggesting that most of our respondents have paid more attention to American data and experiences to date. While majorities believe as well that shutdowns “substantially reduced COVID deaths,” the same pattern of higher confidence for the American claim than the international one shows up, and more respondents were unsure in both cases, as compared to the “delayed cases” argument.
Some critics of prolonged shutdowns have alleged that the Imperial College forecast models produced by Neil Ferguson and colleagues, much discussed in the spring, and cited by government officials in many countries, were a “buggy mess”, “apocalyptic,” and “so wrong they were like shots in the dark.”[i] We asked if the models were too pessimist and too influential, and our respondents were mostly unsure, but, on balance, slightly inclined to agree.
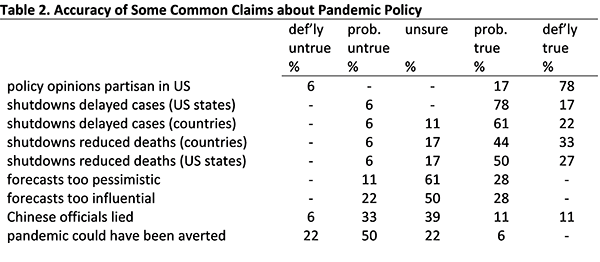
Finally, in the blame debate, opinions vary on how much responsibility lies with China, where the virus began. We asked about the claims that, “Chinese officials deliberately lied about the novel coronavirus following the outbreak in Wuhan” and “If China and the WHO had not misled the world, this global pandemic might have been averted.” The former item divided the experts, while they were mainly willing to deny the latter as probably or definitely not true.
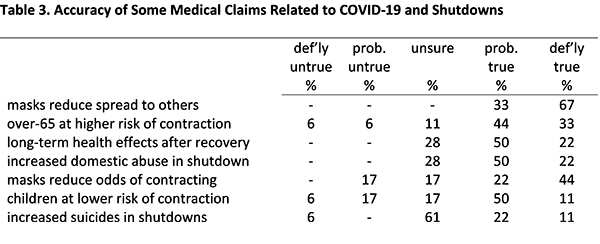
Table 3 shows a second set of claims, this time more medical in nature, regarding pandemic outcomes and policies. The format was similar, as we asked respondents to assess them for truth. Again, our intention was not to score our respondents as right or wrong, but only to discover how unified they are in their judgments.
n=18
The highest consensus emerged on the question of whether masks and facial covering protect others, by reducing the likelihood of spread (given infection). The companion claim that masks also protect the wearer saw more doubt, but “definitely true” was still the most common response.
Most respondents believe that those over 65 years of age are at higher risk of contracting COVID-19 than other adults, and that children are at lower risk than adults, but there was some skepticism and/or uncertainty about both claims, particularly the latter. In regard to two alleged bad side effects of shutdowns, our respondents think that increased domestic abuse is true, but are quite unsure about whether suicides have been on the rise.
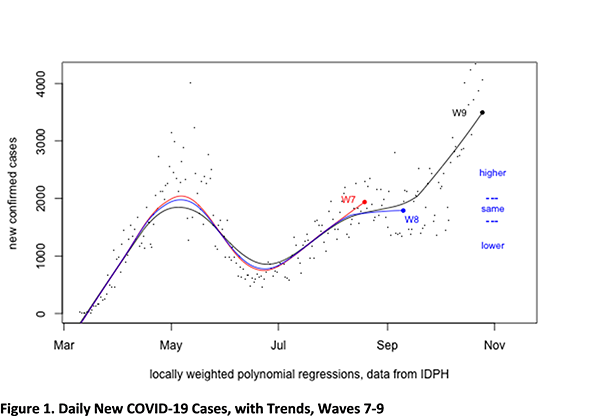
We again confronted the panelists with recent Illinois data, asking for some medium-term forecasts. In mid-September we had asked for predictions about daily new COVID-19 cases and daily deaths of those with COVID-19 as of the end of October. By October 25, with only a few days to go before that prediction point, it seemed clear that the correct predictions would turn out to be that both would be substantially higher.
Figure 1, below, was included in wave nine. It shows the data provided with the August and September survey waves (seventh and eighth, respectively), plus the updated series for daily new COVID cases, as of October 25.
With the benefit of hindsight, the response option we gave for the answer “substantially the same” in September was too narrow an interval, as we probably over-reacted to the flattening in the trend line. Notwithstanding our mistake, respondents also seem to have been too optimistic: 68% expected no change, only 23% thought that the trend would be higher, and the balance were unsure. Sadly, the September slowdown in the new-case rate proved to be rather brief.
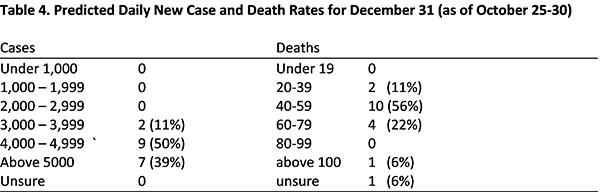
In the October survey, we asked for end-of-year predictions, as we had in August. Table 4 shows that responses were rather pessimistic, with no respondents predicting a decline. This report was delayed, slightly, by the election, and the data for early November display an even sharper rise than was ongoing at survey time. The top category of “above 5,000” may ultimately seem to have been set far too low, in the absence of a major reversal of this surge over the next two months.
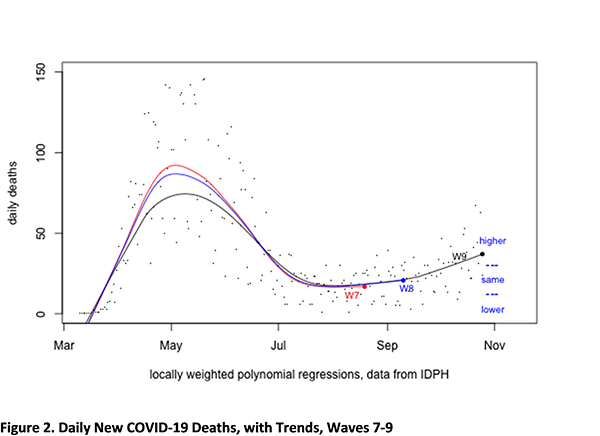
The survey also again featured a companion question about daily deaths of those with COVID-19. Figure 2 is the relevant analog to Figure 1. Again, the correct answer about the end of October, as compared to September 10, turned out to be that the trend was substantially higher. As with cases, our September respondents were too optimistic, with only 24% having predicted an increase, against 64% expecting the same rate, 9% a decline, and 4% reporting being uncertain.
Table 4 shows that October expectations for the end-of-the-year death trend are more dispersed than those for the case trend. The modal answer was forty to fifty-nine an interval that included the status quo (a predicted value of forty-two) on the survey launch date. As of November 4, the increase shown below has turned slightly steeper, with a predicted value now just under fifty.
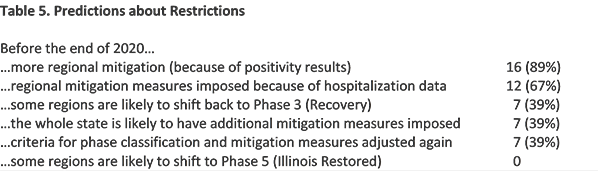
Continuing in the forecasting mode, we also asked respondents about new mitigations and regional classifications, as follows. “As of October 25, all 11 regions of Illinois are still classified as being in Phase 4 (Revitalization). Four of the 11 regions—1 (Southern), 5 (North), 7 (South Suburban), and 8 (West Suburban)—have additional mitigation measures in effect, restricting bar and restaurant operations and maximum permitted meeting size. Region 1 is at "tier 2" while the others are at "tier 1" of mitigation. These were imposed as a consequence of test positivity rates. With which of the following claims do you agree? You may select as many as you like.”
Table 5 shows the number of respondents who selected each option. In short, no one expects improved classifications, and nearly everyone expects further mitigation measures in the near future. Substantial minorities (not the same 7 individuals) also expect more revision of the criteria for restrictions, a re-classification by phase (which presumes exhaustion of the three tiers of mitigation measures), or new restrictions being imposed statewide, rather than on a regional basis.
Voting is over, but vote counting continues. By the next survey wave, which will be the final one in 2020, we should know almost all of the results of the 2020 election. We plan to explore experts’ expectations about how policies will change in the new year, and update their forecasts for vaccine availability.
Appendix. Survey Questions
W9. Q1. In the last two waves of this survey series, we asked for predictions about daily new COVID-19 case levels. We provided a figure showing data from March to just before the survey date. Above is another such figure. [Figure 1, above.] The red series shows the trend as of wave 7, in mid-August, when it was climbing and just under 2000. The blue series shows the trend as of Wave 8, launched September 10. It was flattening at around 1800. In that survey, we asked for a forecast about whether levels would be substantially higher, the same, or lower at the end of October. With less than a week to go, it looks certain that "higher" will prove to have been the correct answer.
What do you think (average) daily new-case levels in Illinois will be at the end of December 2020?
W9. Q2. We have also asked for forecasts of daily deaths of those with COVID-19. Below is a similar figure showing the data with smoothed trends that we presented in survey waves 7 and 8. [Figure 2, above.] In the 8th survey, we asked for a prediction for the end of October, with the options: less than 12; between 13 and 29; and above 30. As of October 25, it appears that "higher" will also prove to have been the correct answer, though the change is less dramatic than with cases data shown above. The predicted value for October 25 is 37 (the seven-day average was 42 and the actual data point for that day was 24).
What do you think will be average number of daily deaths from COVID-19 at the end of December 2020?
W9. Q3. [Question text reproduced above. Exact response options below.]
With which of the following claims do you agree? You may select as many as you like.
W9. Q4. More than half a year has passed since the pandemic reached the United States. Many debates continue about best and worst policies and decisions, with both forward- and backward-looking perspectives. We're interested in your assessment of some of the claims made in such discussions. [Response options: “definitely true”, “probably true”, “unsure about truth”, “probably untrue”, and “definitely true.”]
-The Imperial College forecast models, much discussed in the spring, were too pessimistic.
-The Imperial College forecast models were too influential.
-Country comparisons prove that shutdowns substantially reduced COVID deaths.
-State comparisons in the US prove that shutdowns substantially reduced COVID deaths.
-Country comparisons prove that shutdowns delayed new cases, protecting hospitals and "buying time."
-State comparisons in the US proved that shutdowns delayed new cases, protecting hospital and "buying time."
-Many Americans' interpretations of pandemic policies have been strongly driven by partisanship.
-Chinese officials deliberately lied about the novel coronavirus following the outbreak in Wuhan.
-If China and the WHO had not misled the world, this global pandemic might have been averted.
W9. Q5. We would also like your assessments of some claims that are more directly related to the biology and/or medical side of the crisis. [same response options as Q4.]
-Children are at much lower risk of contracting COVID-19 than young adults.
-Those over 65 are at much higher risk of contracting COVID-19 than younger adults.
-Masks and facial coverings substantially reduce the wearer's likelihood of spreading COVID-19.
-Masks and facial coverings substantially reduce the wearer's likelihood of contracting COVID-19.
-Many of those who recover from COVID-19 will still suffer some long-term health effects.
-Suicides have increased substantially during the pandemic and ensuing shutdowns.
-Cases of domestic abuse have increased substantially during the pandemic and ensuing shutdowns.
W9. Q6. There is some evidence in cross-national surveys that publics are lately placing more weight on economics and less on public health in their views about optimal pandemic policy. For example, the KEKST CNC "Covid-19 Opinion Tracker" has repeatedly asked respondents to choose between: “The priority for the Government should be to limit the spread of the disease and the number of deaths, even if that means a major recession or depression, leading to businesses failing and many people losing their jobs”; and “The priority for the Government should be to avert a major recession or depression, protecting many jobs and businesses, even if that means the disease infects more people and causes more deaths.” Americans have gone from 61% (disease), 20% (recession) in April to 51% (disease), 32% (recession) in October (about 20% declined to choose each time). For other countries, the same change has been: from 54%-26% to 43%-36% in Germany; from 74%-13% to 52%-28% in the UK; from 60%-16% to 43%-25% in Japan; and from 54%-24% to 40%-32% in Sweden. How do you regard these shifts?
End Notes
[i] The data in Table 5 come from the KEKST CNC "Covid-19 Opinion Tracker.” See https://www.kekstcnc.com/insights/covid-19-opinion-tracker-edition-5. Our survey summarized the findings, but not in tabular form (see W9. Q6 in the Appendix).
[i] Douglas Axe, William M. Briggs, and Jay W. Richards, The Price of Panic: How the Tyranny of Experts Turned A Pandemic into a Catastrophe (Washington, DC: Regnery, 2020), xiv, 87, quoting others in regard to “buggy mess.”.
The priority for the Government should be to avert a major recession or depression, protecting many jobs and businesses, even if that means the disease infects more people and causes more deaths.