IGPA is developing several Pandemic Stress Indicators, designed to evaluate the social and economic effects of the COVID-19 pandemic on Illinois residents. The Pandemic Stress Indicators grew out of the work on IGPA’s Task Force on the Impact of the COVID-19 Pandemic.
This first stress indicator is a frequent poll of three sets of experts about pandemic policies. Experts on economics, public health, and/or vulnerable populations from across Illinois have generously agreed to provide regular opinions on various pandemic policies. In answering the surveys, all panelists provide only their personal views and do not offer official positions on behalf of their respective institutions.
On Sept. 14, IGPA invited members of our expert panel to complete the eighth wave of our ongoing Pandemic Stress Indicator survey series. These surveys provide regular updates of views of experts in economics, public health and vulnerable populations regarding pandemic policies. We received 22 responses.
The survey began with a follow-up to a question we asked in the seventh wave, in late August. That survey included Figure 1a, below, showing confirmed daily new cases of COVID-19 and daily new deaths officially attributed to COVID-19 in Illinois, from March 10 through Aug. 19, as recorded by the Illinois Department of Public Health.
We asked respondents to forecast patterns in these trends “over the next few months.” The most popular prediction, from just under half the respondents (10/22=45%), was rises in both new cases and new deaths. About a quarter (6/22=27%) thought that new cases would keep rising but the new-deaths series would stay flat. A few (4/22=18%) expected no rise in deaths and an end to the surge in cases.
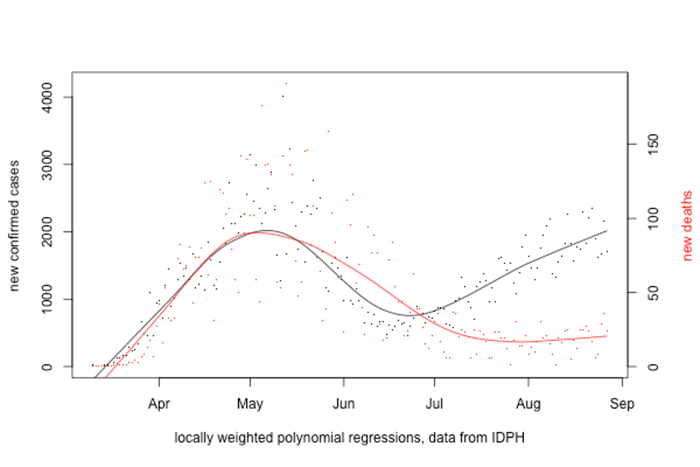
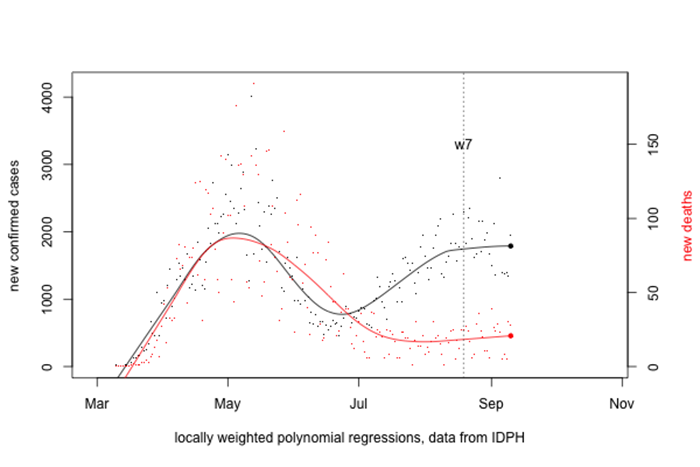
Figure 1. Illinois COVID-19 Daily New Cases and Deaths
a. (top) March 10-Aug. 19, 2020; b. (bottom) March 10-Sept. 10, 2020
Given that wording, it is premature to evaluate the accuracy of those predictions, but the cases series has noticeably flattened in the intervening weeks, so we updated the figure and asked for another forecast, this time with a nearer, specific target date.
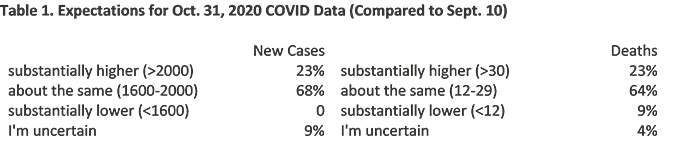
Figure 1b. shows the same data, updated through Sept. 10. We presented it to respondents and asked, “How do you think the average number of daily new cases (from the trend line) will look on Oct. 31, as compared to the value for September 10 (about 1,790 new cases each day)?” A follow-up queried, “…how do you think the average number of daily COVID-19 deaths will look on Oct. 31, as compared to the value for Sept. 10 (about 21)?” Our response options specified intervals, to clarify what kinds of changes we had in mind as “substantial.”
n=22
Table 1 shows that no-change was the modal prediction, for both time series. Except that nobody predicted a decline in new cases, while two respondents expect deaths to drop, the two sets of expectations are nearly identical.
With Figure 1b before them, we also asked respondents to rank by importance seven possible explanations for the second surge of cases. Table 2 shows the explanations we provided, in order of their average ranking, which is in parentheses (lower numbers signifying more importance) along with the number of respondents who ranked the item first. (The items were randomly ordered in the survey.)
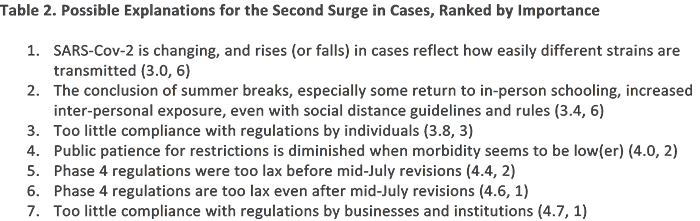
The suspected top culprit proved to be biological, rather than social or legal. In the second spot was a factor that blends normal seasonal change and policy decisions (because some students and teachers are back in physical proximity for normal, in-person classes). Less blame was attached to regulations being too lax than to individuals not complying with these regulations.
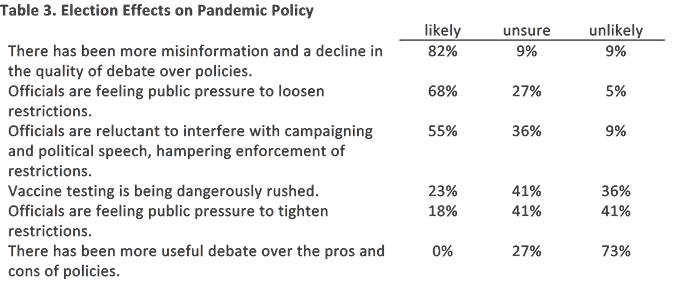
One of our panelists recently suggested that we ask about the effects of the impending election on pandemic policies. To that end, we offered a small set of claims, asking the experts to rate their plausibility. Table 3 shows them in order of perceived likelihood.
n=22
Clearly, the modal view was that the election’s shadow makes matters worse, not better. There was strong agreement that campaign dynamics create lower-, not higher-quality public debate. And, for better or worse, the experts see pressure to loosen restrictions as much more likely than pressure to tighten them. Meanwhile, on the question of whether vaccine testing is being “dangerously” rushed, the most popular answer was “unsure,” better than “likely” but not as reassuring as “unlikely.”
Although few, if any, of the panelists study politics, as such, we included a few questions reversing that framing, asking about the pandemic’s likely effects on the election. Most expect a more chaotic election because of (emergency-justified) changes in voting procedures. Other possible consequences, including a spike in cases, drew mostly “unsure” response. Interestingly, the respondents mostly do not expect reduced turnout.

n=22
The survey also included a pair of open-ended questions asking how Illinois and the United States are handling the pandemic, compared to peers, and why each is doing better or worse. We did not present figures comparable to Figure 1b above for any other states or nations and did not necessarily have in mind quantitative comparisons or precise rankings.
Opinion on the Land of Lincoln was, on balance, mainly positive. Ten respondents said it is faring “slightly better”, “a little better” or “better” than some comparison group (mostly surrounding states, but sometimes large states). Four responses were less positive: “about the same as other states in the upper Midwest”; “better than some, worse than others”; “OK but not really meaningfully different”; and “in the middle of the pack.”
More nuanced responses emphasized within-state variation, one respondent identifying urban areas as trouble spots to date, and another singling out rural areas for worrying recent trends. Explanations for comparatively good outcomes included praise for the governor, somewhat earlier, tighter or broader “lockdown” restrictions, and unusually good monitoring and/or testing. Even some positive reviews were tempered with qualifications, including that nursing homes are still not under control and “without coordinated action across the country, it doesn't make sense for one state to stay shut down”.
Assessment of the U.S. was nearly universally poor, with nine variations on “worse”, four on “much worse”, plus “worse, worse, worse”, “a disaster” and “an international embarrassment.” The least negative ratings were probably, “doing worse than most but not all rich countries” and a few responses mentioning (poorer) countries doing even worse (e.g. Brazil, India).
The most frequent culprits cited were lack of a national policy, decentralized or tardy response, too little reliance on scientific experts, poor leadership (President Donald Trump being named only twice, but “the administration” also criticized), politicization of policy, and subpar public-health infrastructure.
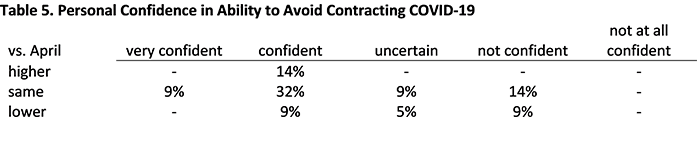
One question asked experts how confident they presently feel about being able to avoid contracting COVID-19, and how this mid-September confidence compares to how they felt back in April. Most respondents chose “confident,” which was mostly described as the same feeling as five months prior. On the plus side, 64% are confident or very confident, and no one chose “not at all…”; on the other hand, more respondents reported decreasing (23%) than increasing confidence (14%).
n=22
Looking ahead to our October wave, we anticipate further questions on the interplay of electioneering and pandemic policies. As of late September, the U.S. and several other prosperous nations that have seemed to be faring better than the U.S., including Canada and much of Europe, are seeing an uptick in COVID-19 cases. If that trend persists, it will certainly merit some expert analysis. Following up on prior panelist suggestions, we will also revisit experts’ sense of which changes in day-to-day routines seem likely to persist beyond this public-health emergency.
Appendix. Exact Question Wordings.
W7. Q1 Since late-June, trends in new cases of COVID-19 and in deaths from COVID-19 in Illinois have diverged. There has been a steady increase in new cases (a "second wave"), but the number of deaths each day has largely held constant. Previously, over the first wave, the two series had looked very similar. There are many theories for what explains this changed pattern, which is not unique to Illinois, but there does not yet seem to be consensus on one or two main factors. Regardless of why cases and deaths are no longer in sync, what do you expect to see in these data over the next few months? (accompanied by Figure 1a, above)
[response options: new cases will level off or fall and deaths will stay level;
new cases will level off or fall and deaths will start to rise;
new cases will keep rising and deaths will also start to rise;
new cases will keep rising and deaths will stay level;
other]
W8. Q1. In the most recent (seventh) wave of this survey, launched August 19, we asked this question. "Since late-June, trends in new cases of COVID-19 and in deaths from COVID-19 in Illinois have diverged. There has been a steady increase in new cases...but the number of deaths each day has largely held constant. Previously...the two series had looked very similar....(W)hat do you expect to see in these data over the next few months?" Below, we update the figure that accompanied that question through Sept. 10. How do you think the average number of daily new cases (from the trend line) will look on Oct. 31, as compared to the value for Sept. 10 (about 1790 new cases each day)? (accompanied by Figure 1b, above)
[response options in Table 1]
W8. Q2. As you consider the increase in new COVID-19 cases that Illinois has experienced since late June, how would you rank the following factors as possible causes? Please rank from high (most likely to be causing the rise) to low (least likely to be causing the rise).
[factors listed above, in text]
W8. Q3 Still thinking about the data shown above, how do you think the average number of daily COVID-19 deaths will look on Oct. 31, as compared to the value for Sept. 10 (about 21)?
[response options in Table1]
W8. Q4. As November nears, many are speculating on how the pandemic will affect the general election. Do you have opinions about the likelihood of these possible effects?
[items listed above, with response options of “likely”, “unsure”, and “unlikely”.]
W8. Q5. On the other side, do you think that the impending general election is having effects on policies being implemented by elected officials?
[items listed above, with response options of “likely”, “unsure”, and “unlikely”.]
W8. Q6. How confident do you personally feel that you can avoid contracting COVID-19 under present circumstances?
very confident; confident; not too confident; not at all confident; I'm uncertain
W8. Q7. How would you compare your confidence about being able to avoid COVID-19 now, in mid-September, to how you felt in mid-April?
confidence is higher; confidence is about the same; confidence is lower; I'm uncertain
W8. Q8. How would you compare your confidence about being able to avoid COVID-19 now, in mid-September, to how you felt in mid-April?
W8. Q9. What is your sense of how Illinois compares in to other American states in regard to COVID-19 at present, and why it is doing better or worse at managing the pandemic?
W8. Q10. What is your sense of how the U.S. compares to other countries in regard to COVID-19 at present, and why it is doing better or worse at managing the pandemic?
How do you think the average number of daily new cases (from the trend line) will look on Oct. 31, as compared to the value for September 10 (about 1,790 new cases each day)?